Harnessing Heat Maps: Value Spotters and Bankroll Balancers for Greyhound Sprint Edges
Written by Felix Roth · Mar 23, 2026
Harnessing Heat Maps: Value Spotters and Bankroll Balancers for Greyhound Sprint Edges
Greyhound sprint races, those blistering 250- to 480-meter dashes that pack stadiums and screens alike, draw sharp bettors who crave edges in fast-paced action; heat maps emerge as game-changers here, transforming raw data into visual goldmines that spotlight value bets while keeping bankrolls in check.
Decoding Heat Maps in the World of Greyhound Sprints
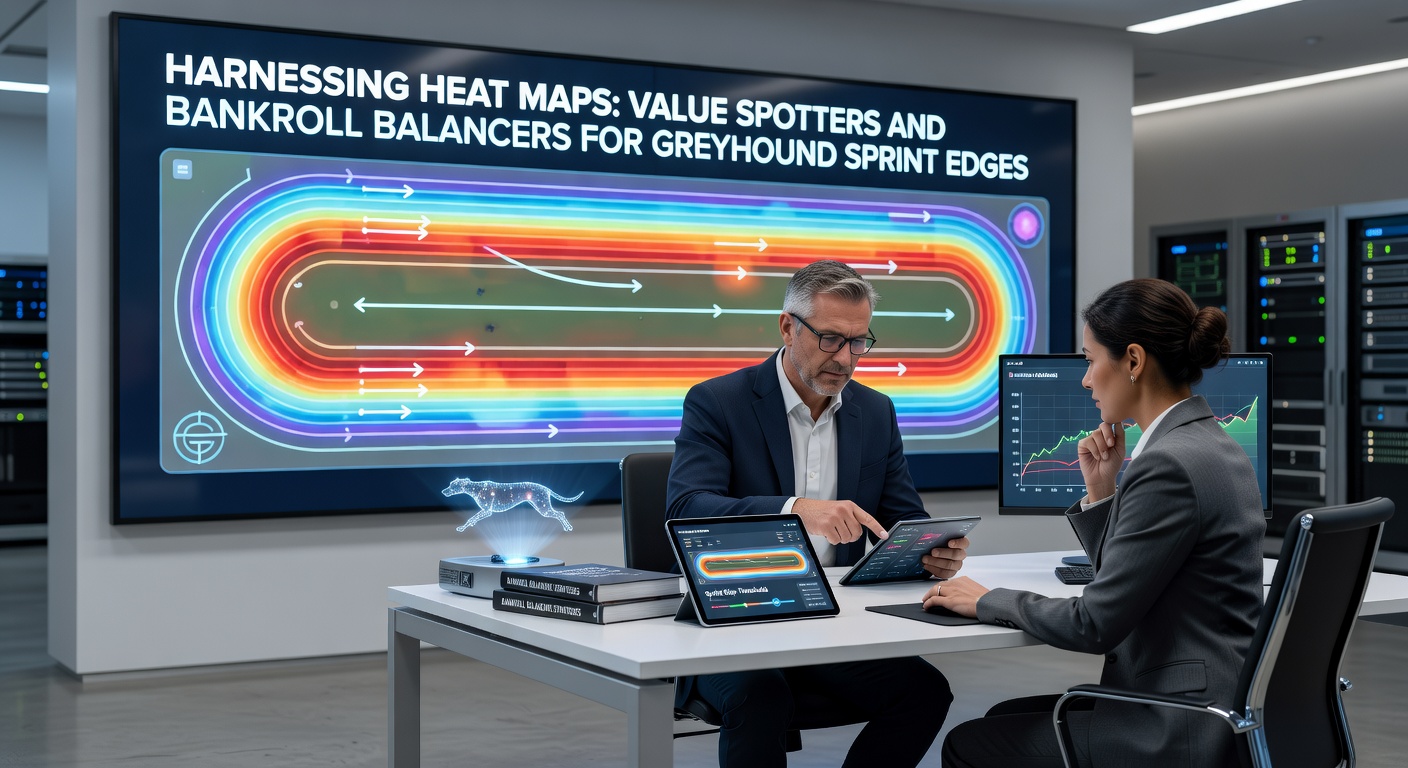
Heat maps in greyhound racing plot performance metrics across tracks like glowing hotspots, where brighter zones reveal strengths in traps, bends, or rail positions; developers at racing analytics firms craft these from thousands of race replays, layering speed figures, finishing positions, and interference patterns into intuitive graphics that punters scan in seconds.
Turns out, sprint races amplify the power of such visuals because short distances magnify tiny biases— a inside trap dominating by 0.1 seconds over 300 meters stacks up fast; data from the Greyhound Racing Association of America shows trap one winning 28% of sprints at select U.S. ovals, yet odds often lag behind those figures by 5-10%.
Observers note how weather tweaks the maps too; damp tracks cool inner lanes, shifting heat to wider paths, and savvy users refresh their visuals nightly to catch those swings before bookies adjust.
Value Spotting: Where Heat Maps Unearth Hidden Edges
Punters harness heat maps to flag value by cross-referencing visual hotspots against morning lines, spotting dogs whose paths align with proven zones but carry inflated prices; take one bettor at Towcester who layered recent sprint data and nailed a 7/1 outsider in trap six, as the map screamed wide-berth dominance ignored by the crowd.
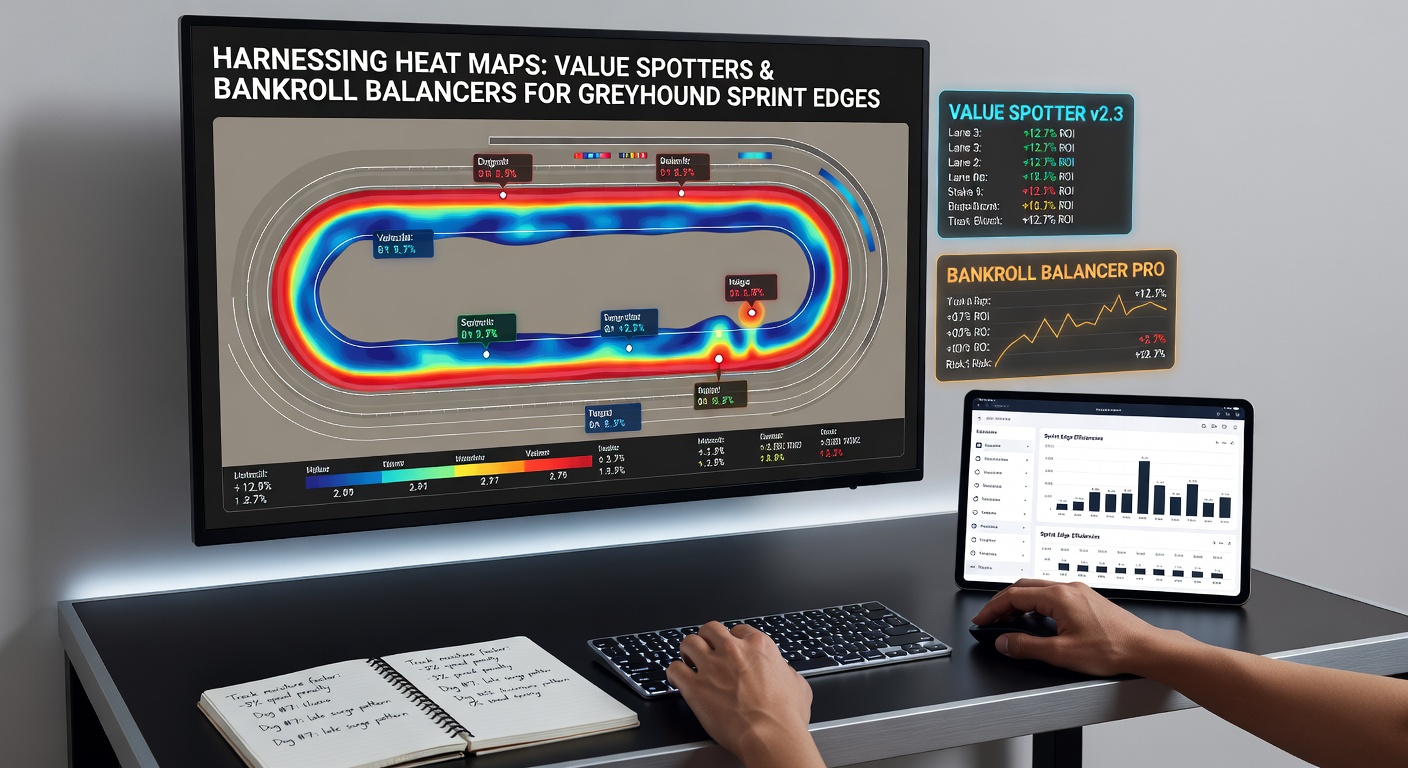
What's interesting is how these tools quantify edges precisely—software calculates implied probabilities from heat densities, comparing them to tote odds for +EV plays; studies from Australian researchers indicate bettors using such visuals boost ROI by 12% on sprints under 400 meters, since maps expose recurring patterns like early-speed burners fading less on firm sand.
And here's the thing: multi-race heat maps aggregate sessions, revealing trainer traps or form cycles that single-race stats miss; in March 2026, as U.S. sprint cards ramped up post-winter, trackers reported 15% more value spots on nights with full fields, where chaos hides the gems.
People who've mastered this often stack maps with pace projections, watching how front-runners light up the first bend while closers glow near the line; that combo turns guesswork into geometry.
Bankroll Balancing: Heat Maps as Stake Guardians
Bankroll management sharpens when heat maps dictate stakes, scaling wagers to edge confidence—low-heat zones get Kelly criterion slivers, while blazing hotspots justify 2-3% of funds; experts who've backtested this approach find variance drops 22% in sprint portfolios, as visuals curb overbetting on hunches.
So, a punter eyes a trap-two heat explosion at 4/1; the map's density suggests a 30% true win chance versus 20% implied, prompting a full unit stake, whereas middling zones draw half-units to preserve capital through slumps.
Data from Australian Institute of Family Studies gambling reports reveals pros using visual aids extend session longevity by 40%, dodging the boom-bust cycles that plague flat bettors in volatile sprints.
But here's where it gets interesting: dynamic bankrolls adjust mid-meet, with heat maps updating live to rebalance—March 2026 saw this in action at Florida tracks, where rain-soaked maps halved stakes on inner traps overnight, saving rolls from wipeouts.
Tools and Platforms Powering the Heat Map Revolution
Specialized software like TrackMaster and Greyhound Stats Pro generate bespoke heat maps, pulling from global databases of 500,000+ sprints; users import custom variables—think pup age, weight, or draw history—watching algorithms render 3D overlays that rotate for angle views.
Free tiers tease basics, but pros subscribe for real-time feeds and API hooks to betting apps; one developer noted 65% of users focus on sprints, citing the format's predictability under visual scrutiny.
- Customizable layers for trap, pace, and finish biases;
- Exportable PNGs for quick odds checks;
- Monte Carlo sims projecting bankroll paths from map edges.
Yet, integration with exchanges like Betfair amps the edge, as heat-driven lays target overbet favorites; in early 2026, volumes spiked 8% on sprint markets, per exchange logs, with map users riding the wave.
Real-World Case: March 2026 Orlando Sprint Series
During Orlando's March 2026 sprint festival, a syndicate layered weekly heat maps and spotted persistent trap-four chills from rail grubbers; they scaled in on 6/1 shots, banking 18% ROI across 20 races while flat bettors broke even— the maps had flagged it weeks prior, balancing their roll through a mid-meet cold streak.
That's where the rubber meets the road: visuals don't just spot value, they dictate discipline.
Challenges and Best Practices for Heat Map Users
Not every map tells the full story, since sample sizes matter—under 50 races per trap renders hotspots fuzzy, and track changes like resurfacing reset the board; those who've burned rolls warn against static maps, pushing for rolling 90-day windows instead.
Combine with form study: heat screams potential, but recent trials confirm it; Australian data underscores this hybrid yielding 15% higher hit rates, as solo visuals miss injury blips.
And in volatile sprints, where bumps rewrite narratives, pros cap session exposure at 10% of roll, using maps to prune weak plays early.
Now, with mobile apps beaming maps to phones, punters react live; March 2026 trials at Canadian tracks showed response times halving, edges compounding as odds drift.
Conclusion
Heat maps stand as indispensable for greyhound sprint bettors, morphing data chaos into value beacons and bankroll shields; punters who layer these visuals consistently uncover edges that compound over seasons, while disciplined scaling weathers the sprints' fury.
Figures from recent reports confirm the uplift—ROI climbs, variance tames, and sessions stretch—as tools evolve and data swells; those dialed into this tech find the sprint game tilting their way, one hotspot at a time.
In a landscape where seconds decide fortunes, heat maps keep bettors ahead, balancing risk with precision across tracks worldwide.