Integrating Multiple Indicators for Edge Detection in Extended Athletic Events
Written by Felix Flores · Jun 12, 2026
Integrating Multiple Indicators for Edge Detection in Extended Athletic Events
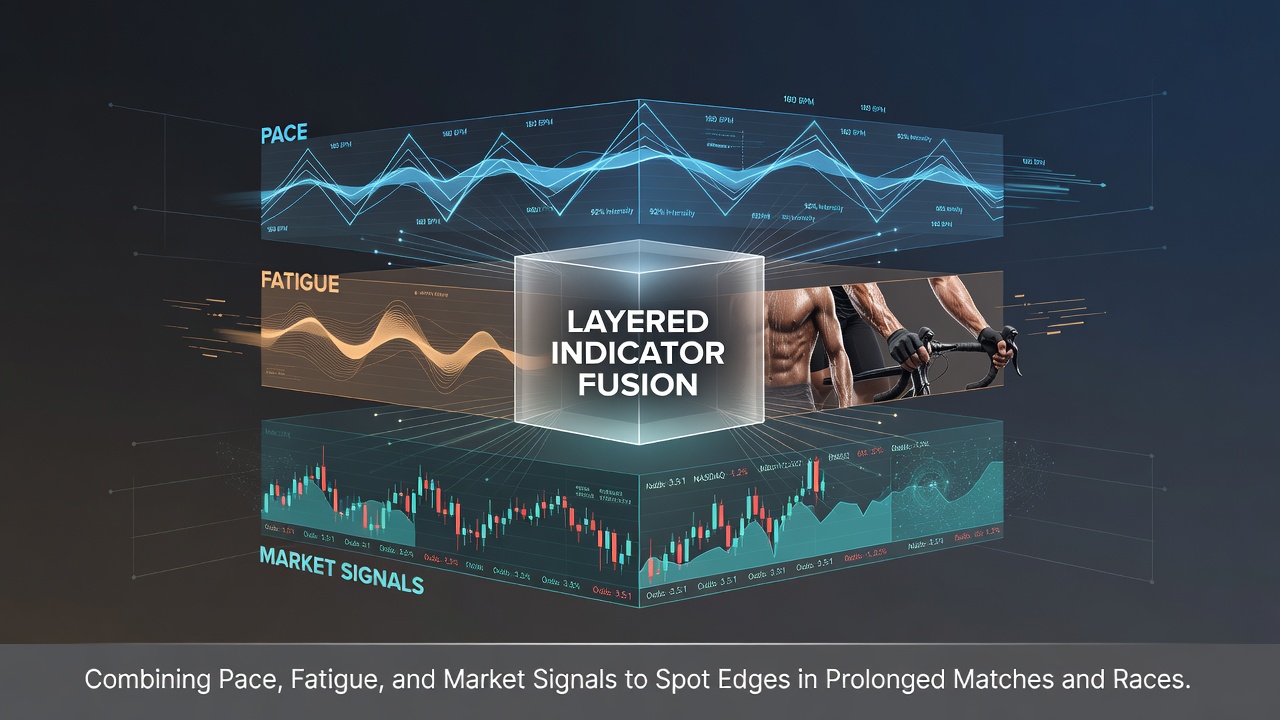
Layered indicator fusion brings together pace measurements, fatigue assessments, and market fluctuations to identify potential advantages during lengthy competitions such as five-set tennis matches or endurance horse races that stretch across multiple stages. Observers note that prolonged events create layered data environments where single metrics often fall short, while combined signals reveal shifts that develop over time. Research from sports analytics groups indicates that athletes and competitors exhibit measurable changes in output as events extend beyond standard durations, with patterns emerging around the 90-minute mark in many team sports and after the third set in individual matchups.
Pace Analysis as a Foundation Layer
Pace tracking starts with baseline speed calculations drawn from historical performances, then adjusts for course conditions or court surfaces that influence movement rates. Data shows that competitors who maintain consistent velocity through early phases often experience drops that correlate with later outcomes, yet these declines only become predictive when cross-referenced against other factors. In flat racing circuits, for instance, sectional timing data collected during June 2026 events demonstrated how early leaders who exceed average pace benchmarks by more than 8 percent frequently underperform in the closing stages. Those studying these patterns combine raw timing figures with environmental variables such as temperature and track moisture to refine the initial layer before adding further indicators.
Fatigue Metrics and Their Integration Points
Fatigue evaluation draws from physiological markers including heart rate recovery intervals, stride length variations, and error rate increases that accumulate across extended play. Studies conducted by university research teams in Australia have linked specific fatigue thresholds to performance decrements in both human and equine athletes, with measurable impacts appearing after 120 minutes of continuous effort in many cases. This layer gains value when fused with pace data because isolated fatigue readings can misrepresent situations where competitors adapt through tactical adjustments rather than outright decline. People analyzing these combinations often track recovery windows between points or jumps, noting that shorter intervals between exertions accelerate fatigue buildup while longer pauses allow partial restoration that alters expected trajectories.
Market Signals as the Third Dimension
Market movements provide real-time reflections of collective assessments, with odds adjustments capturing shifts that traditional statistics might overlook until after the fact. Live betting platforms record volume spikes and price drifts that align with on-field developments, creating an additional data stream that responds faster than post-event reviews. Figures from European sports data providers reveal that significant market corrections during extended contests frequently precede visible performance changes by several minutes, offering a timing advantage when layered against pace and fatigue readings. This signal operates differently across regions, with North American markets showing sharper reactions to injury reports while Asian exchanges tend to emphasize volume patterns tied to participant origins.
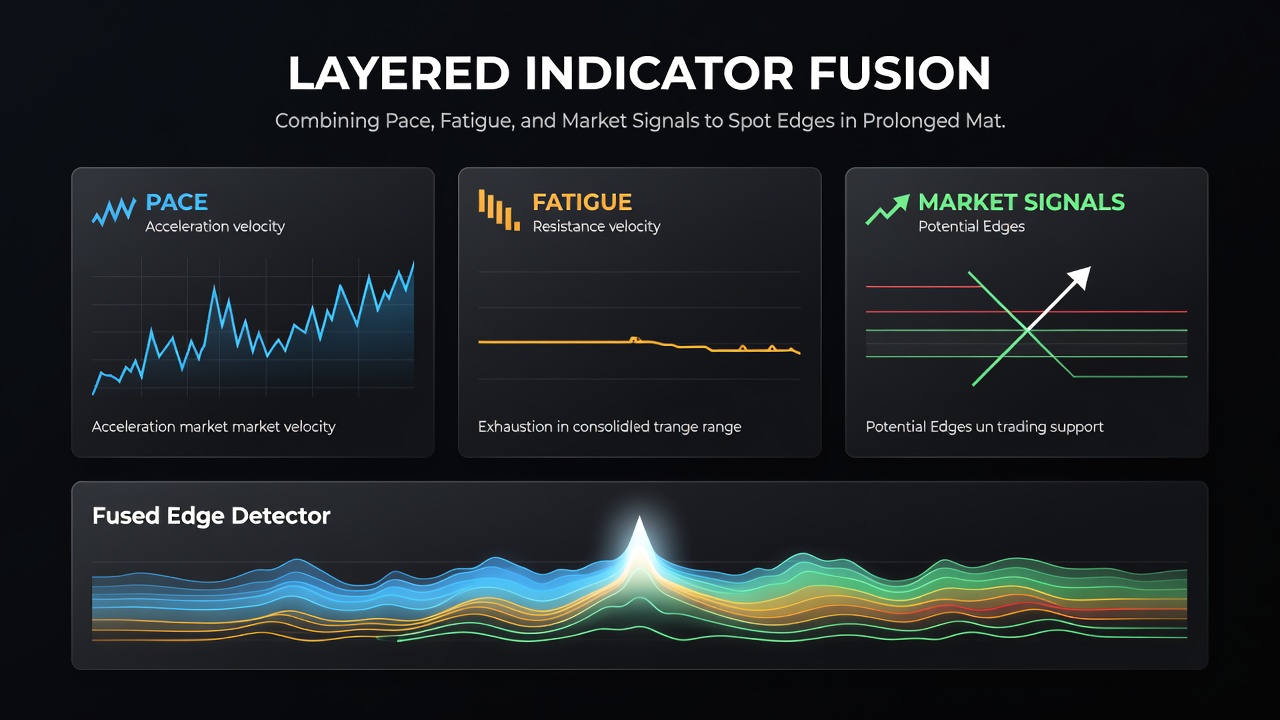
Combining these three layers requires systematic alignment where each indicator validates or contradicts the others at key decision points. A competitor showing pace consistency yet displaying early fatigue markers alongside stable market pricing presents a different profile than one experiencing all three signals moving in the same direction. Software tools developed for this purpose process incoming data streams simultaneously, generating composite scores that highlight moments when multiple indicators converge. Industry reports from Canadian gaming research centers highlight how such integrated approaches have gained traction among professional bettors who manage positions across multi-hour events rather than relying on single snapshots.
Application in Specific Event Types
Tennis matches that reach deciding sets provide clear testing grounds for this method because fatigue accumulates visibly through unforced error counts and serve velocity reductions that align with market price movements. Observers tracking grand slam encounters during the 2026 season recorded instances where pace drops in the fourth set coincided with fatigue indicators and subsequent odds shifts favoring the opponent. Horse racing over distances exceeding 2400 meters follows similar logic, with sectional data revealing when early speed exerts create fatigue that markets begin pricing in during the final furlongs. Soccer fixtures extending into extra time introduce additional variables such as substitution patterns that affect both team pace distribution and collective fatigue levels, with market liquidity often increasing as these changes unfold.
Implementation typically follows a staged process where initial pace baselines establish reference points, fatigue projections adjust those baselines according to elapsed duration, and market data supplies confirmation or divergence signals. This sequence avoids over-reliance on any single source while creating multiple verification checkpoints throughout an event. Academic papers published through sports science journals demonstrate that models incorporating all three layers achieve higher alignment with actual outcomes compared to pace-only or market-only approaches, particularly in competitions lasting beyond 150 minutes.
Technical Considerations for Data Handling
Data synchronization presents ongoing challenges because pace measurements arrive at irregular intervals while fatigue estimates require continuous monitoring and market feeds update in fractions of seconds. Systems designed for layered fusion employ timestamp matching protocols that align these streams within acceptable tolerance windows, usually under 30 seconds for most applications. Those working with such tools emphasize the importance of source reliability, noting that discrepancies between timing systems or physiological sensors can distort composite outputs when events stretch into later stages. Geographic variations also influence data quality, with some regions providing denser sensor networks for equine events while others focus resources on racket sports venues.
June 2026 brought increased attention to these methods as several international tournaments extended into multiple days with overlapping schedules, creating demand for analytical approaches that handle simultaneous prolonged events. Regulatory bodies in various jurisdictions have begun examining how such data-driven techniques intersect with responsible participation guidelines, though frameworks remain focused on transparency rather than restriction of analytical methods.
Conclusion
Layered indicator fusion operates through deliberate combination of pace tracking, fatigue assessment, and market observation to surface patterns that develop across extended durations in competitive events. The approach relies on cross-validation between independent data streams rather than isolated readings, producing signals that reflect cumulative effects rather than momentary fluctuations. Continued development in sensor technology and data integration platforms supports wider application across different sports and racing formats, while research efforts examine optimal weighting between layers for various event lengths and conditions.