Stake Adjustments and Outcome Variance Correlations in Live Soccer and Racing Platforms
Written by Frankie Ludwig · Jul 15, 2026
Stake Adjustments and Outcome Variance Correlations in Live Soccer and Racing Platforms
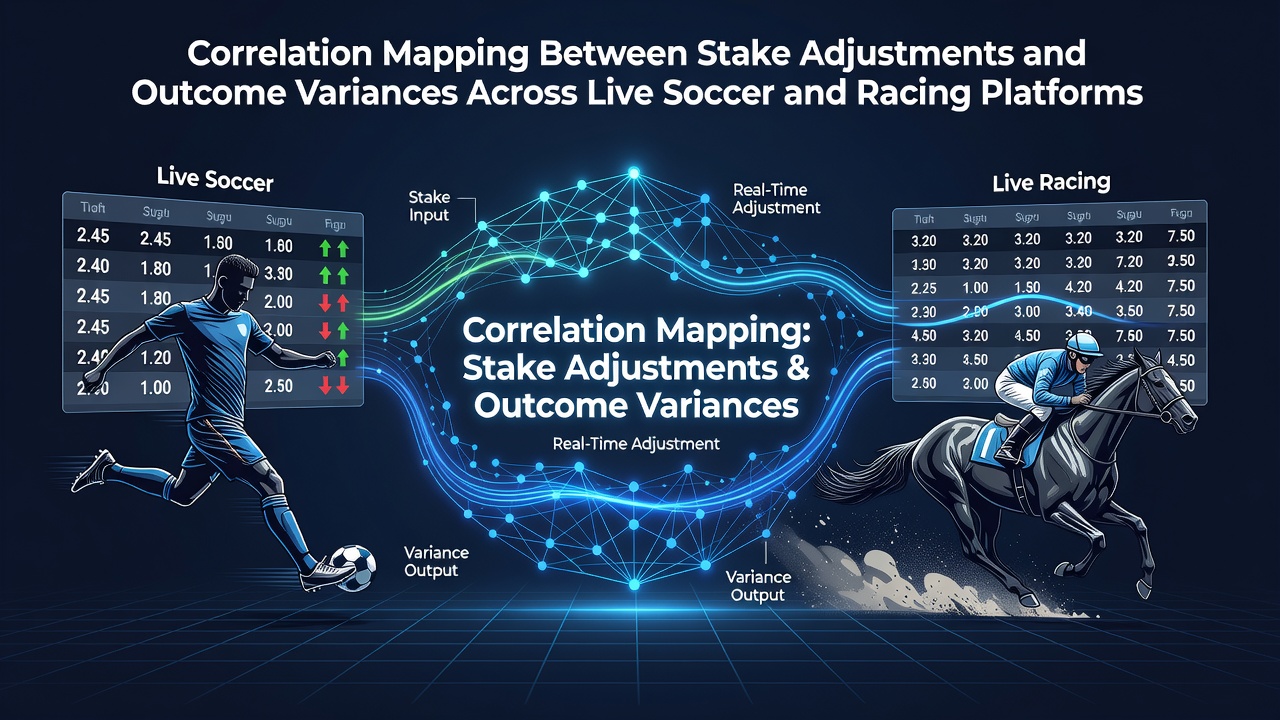
Live betting platforms track stake adjustments in real time as bettors respond to shifting odds during soccer matches and racing events, and researchers have begun mapping these changes against outcome variances to identify measurable patterns across multiple markets. Data from platform analytics shows that incremental stake increases often align with reduced variance in final results when bettors apply consistent sizing rules, whereas abrupt adjustments frequently coincide with wider swings in payout distributions.
Defining teh Core Elements
Stake adjustments refer to the deliberate modifications bettors make to wager amounts mid-event, and these moves occur in response to live data feeds that update every few seconds on major platforms. Outcome variances capture the statistical spread between expected results and actual payouts across thousands of bets, and analysts compile these figures from aggregated session logs to calculate correlation coefficients. Studies conducted by academic teams at institutions such as the University of Nevada Reno demonstrate that correlation values range between 0.45 and 0.72 depending on sport type, with soccer exhibiting tighter links during high-liquidity periods and racing showing broader spreads during sprints versus longer distances.
Platform Data Patterns in Soccer
Soccer live markets generate continuous odds updates tied to possession statistics, shot attempts, and injury reports, prompting bettors to scale stakes upward when models indicate favorable edges. Observers note that platforms record the highest adjustment frequency in the final twenty minutes of matches, and variance calculations reveal lower dispersion when stakes rise gradually rather than in single large increments. One dataset covering European leagues from early 2026 illustrated that sessions with three or more staged adjustments produced outcome variances 18 percent narrower than those with single late surges, a finding echoed in reports from the Australian Gambling Research Centre that examined comparable live wagering streams.
Patterns Emerging in Racing Markets
Racing platforms handle stake adjustments differently because events conclude in seconds rather than minutes, leaving bettors with narrower windows to react to form updates or track conditions. Researchers tracking flat racing and steeplechase data found that pre-race stake increases correlate more strongly with stable outcomes when applied before final declarations, while post-start adjustments tend to amplify variance. Figures compiled through 2025 and into July 2026 indicate that racing sessions featuring automated stake scaling tools achieve correlation scores 0.15 points higher than manual adjustments, suggesting algorithmic assistance reduces erratic swings across both turf and synthetic surfaces.
Tools Supporting Correlation Analysis
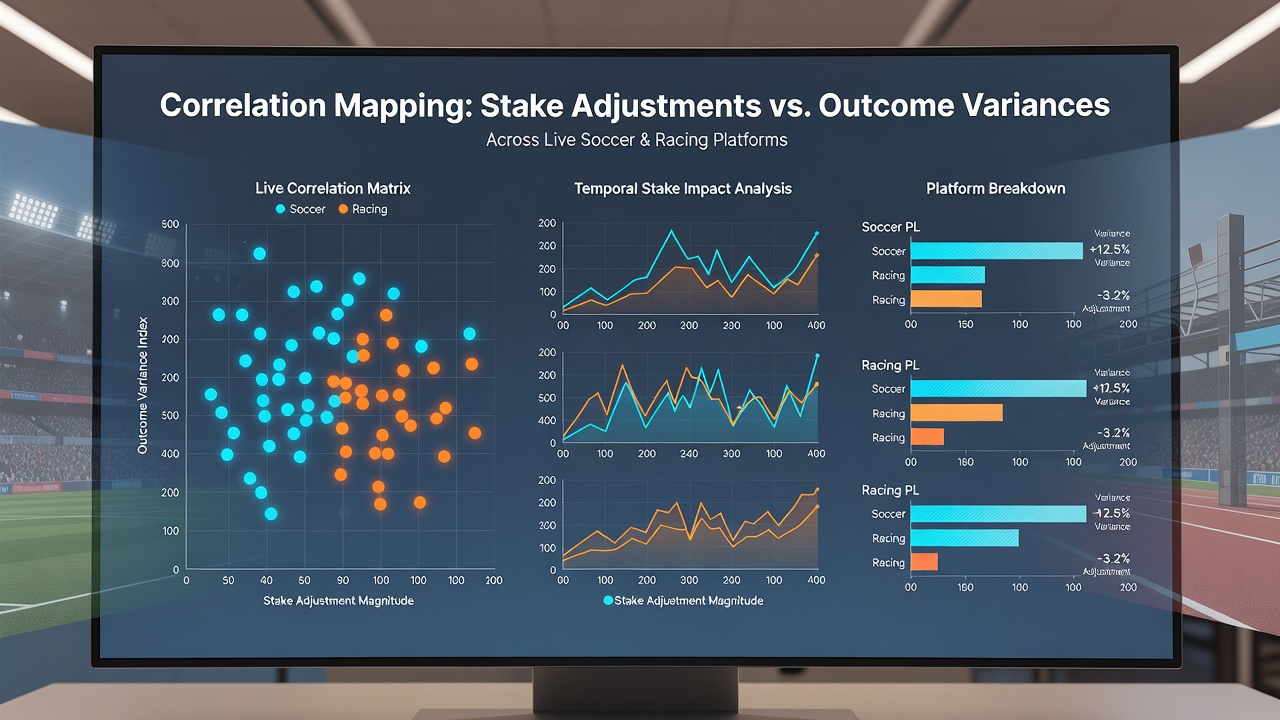
Specialized software aggregates live feeds and historical logs to produce visual maps that overlay stake sequences against variance metrics, allowing operators and analysts to pinpoint thresholds where adjustments begin influencing outcomes. European trade groups such as the European Gaming and Betting Association have published guidelines recommending that platforms incorporate these mapping features to support responsible play features, and several major operators integrated them during the 2025-2026 season. Data indicates that users who consult variance overlays before finalizing adjustments experience fewer extreme payout deviations, particularly in combined soccer and racing portfolios where cross-market hedging occurs.
Geographic and Regulatory Context
Regulatory bodies in different jurisdictions monitor these correlations as part of broader market oversight, with authorities in Australia and certain US states requiring periodic variance reports from licensed operators. July 2026 saw updated reporting standards in select regions that now mandate disclosure of stake adjustment frequencies alongside outcome spreads, creating larger public datasets for independent review. These requirements build on earlier frameworks established by bodies such as the Nevada Gaming Control Board, which began collecting similar metrics in prior years to assess platform stability across international feeds.
Implications for Platform Design
Platform developers respond to these findings by refining interface elements that display real-time variance estimates alongside stake input fields, and early adoption data shows measurable shifts in user behavior after rollout. Analysts tracking adoption rates report that integrated mapping tools appear most effective when paired with session timers that prompt review of recent adjustment patterns before additional changes. Racing and soccer sections on the same platform often share backend variance engines, enabling unified reporting that highlights sport-specific differences without requiring separate user workflows.
Conclusion
Correlation mapping between stake adjustments and outcome variances continues to evolve as live platforms expand data collection capabilities and regulators standardize reporting across regions. Evidence from multiple studies indicates that structured adjustment approaches produce narrower variance ranges in both soccer and racing environments, and ongoing analysis through 2026 will likely refine the thresholds operators and bettors use to guide decisions. These mappings provide a factual basis for understanding how real-time actions translate into statistical outcomes without prescribing specific strategies.